Capturing Geospatial Metadata
A UX Research Case Study for Ag Data Commons
Overview
Ag Data Commons is a research repository platform used by the United States Department of Agriculture (USDA) National Agricultural Library to help researchers preserve and share their agricultural data sets. Built on Figshare (a research repository platform), it serves as a critical tool for making government-funded research publicly available and accessible.
As part of an initiative to improve how researchers capture geospatial metadata, the product team asked me to conduct user research to understand how researchers work with location-specific data and identify ways to improve the metadata capture process. This case study examines the research process, key insights discovered, and the strategic approach taken to address long-standing usability issues.
The research covers diverse use cases from remote sensing vegetation analysis to multi-location crop trials, with this functionality expected to be available to all Figshare users, not just the USDA.
Why this matters
Context - Each map feature carries its own information;
Discovery - People can find datasets covering their region;
Interoperability - Metadata travels with the geographic data.
Problem statement
Let's start with GeoJSON. This a way to store and share location data (maps, coordinates, shapes) in a simple text format. It has two main roles: defining geographic coverage ("bounding box" or "footprint", the area or boundaries of where research took place) and storing attributes/properties for each feature.
Currently, most researchers do not provide GeoJSON, instead entering coordinates in various formats that require manual conversion by curators.
So why is this a problem?
First, curators need to figure out what they're looking at. Are these single points? Multiple separate locations? Or are the researchers trying to draw a polygon around an area? This isn't always obvious from what researchers submit.
Then comes the tedious part. Curators open up a notepad and start copying and pasting coordinates, reformatting them into valid GeoJSON. They appear to use templates to speed things up, but it's still a lot of manual work.
The tricky cases make it even harder. When researchers submit coordinates in degrees/minutes/seconds format (like 44°25'16"N) instead of decimal degrees, curators have to convert those first before they can even start building the GeoJSON.
All this means research data is harder to discover. When geographic information isn't properly structured, other researchers can't easily search for datasets in their area of interest. For example, a study conducted in California might be virtually invisible to someone looking for United States West Coast research simply because the location data wasn't formatted correctly.
Bottom line: time-consuming, error-prone process that relies heavily on curators knowing what researchers meant to submit, and it also makes valuable research harder to find.
How might we create a geospatial metadata workflow that works for both researchers (easy input) and curators (minimal manual work) while maximizing data discoverability?
Research approach
I conducted user research interviews as part of a needs assessment process with the USDA team to help improve geospatial metadata capture in Ag Data Commons. Had conversations with the curation team, then spoke to researchers who actually use the system to understand more about them, what they do, and what they like and don't like, with the view to making a solution that is as easy to use as possible.
Interview focus areas
The sessions were informal conversations where the users had an opportunity to ask questions too. The interviews started with general questions about the participant's role, experience, background, and the research they conduct.
I first wanted to understand who the users are and what their research purpose is. I explored how they currently input location data, the challenges they face, and their needs for discovering geospatial datasets.
Analysis
With participant consent, I recorded all interviews and then reviewed the transcripts to identify patterns: Where were users struggling? What workarounds did they have? What did they wish they could do but currently couldn't?
Key research findings
The research revealed several critical insights that completely reshaped how we thought about this problem.
Finding 1: Most users don't know what GeoJSON is
The vast majority of users do not provide a GeoJSON but latitude-longitude points in various formats. There is a variety of entry models because the field is free text and people can pretty much enter anything. Curators must manually convert user-provided coordinates into valid GeoJSON format, identifying geometry types (points, polygons, bounding boxes) and reformatting coordinates, which takes extra time.
"I will say the vast majority of people do not provide GeoJSON."
Michal - Data Curator
Researchers aren't GIS specialists. They're biologists, agronomists, and soil scientists who happen to conduct research at specific locations. Expecting them to learn a technical data format just to share where their research took place created an unnecessary barrier.
"9 times out of 10, they'll provide the coordinates in the opposite order that we need them. So it does take an extra second to make sure that you put the coordinates in the right spot."
Jonathan - Data Curator
Finding 2: Visual feedback is essential for all user groups
Nobody could verify their location data without leaving the platform. Researchers couldn't confirm they've entered the right coordinates. Curators couldn't quickly spot errors. End users viewing published datasets couldn't understand where research took place without copying code into external visualization tools.
When research spans multiple locations, users need to see these locations on a map with labels to understand what's what. Raw coordinate lists don't convey this information effectively.
"Being able to say Michigan site or Montana site, like those kinds of things would be really helpful to have like a small little a label."
Erika - Remote Sensing Specialist
Finding 3: Different research scenarios need different approaches
Single location studies (like Brian's genomics work): Research conducted at one experimental station or field site. Simple point-based entry would work perfectly.
Multi-location studies (like Erika's satellite work): Research spanning multiple distinct sites that might be far apart. Users needed the ability to add multiple points and label each one to distinguish between "Wyoming site" and "Colorado site."
Regional studies (like Paul's GIS work): Research covering broader areas. Bounding boxes or polygons make more sense than individual points.
"I think in the future we will be publishing papers with multiple locations very far away from each other."
Erika - Remote Sensing Specialist
Erika's forward-looking comment reminds us that we're not just solving for today's needs, we're building infrastructure for how agricultural research is evolving toward more multi-site, comparative studies.
Finding 4: Users want to avoid duplicate work
Researchers don't want to recreate location data that already exists somewhere in the system.
Erika had specifically reached out to a colleague to find existing location datasets she could reference rather than re-entering the same information. This workaround revealed an important insight: location data often gets reused across multiple studies at the same site.
Finding 5: Search and discovery by location is a primary motivator
Researchers want to meet the requirements of getting their data out there in a meaningful format that's understandable and easy to data mine, not necessarily even right now, but in the future, especially with advances in computing and machine learning.
"I don't think we're to the point where it's normal to like go to Ag Data Commons before you go to publications and search for data. But I do see that hopefully being the norm in 5-10 years."
Brian - Computational Biologist
Brian's perspective is particularly interesting because he doesn't primarily work with geospatial data. Yet even he could see value in searching for research from specific regions to enable cross-disciplinary comparisons.
One user emphasized "the importance" of "findability and accessibility" and "an ability to integrate spatial and temporal dimension and to search for users who come to a data comments, to discover shared data."
Research participant - Researcher
Users don't typically search for exact coordinate matches. They search at a broader level, like what research has been done in this state, this county, this agricultural region. The system needs to support both precise location metadata and flexible geographic search.
Finding 6: Three user groups, one interface
Submitters (Researchers): Need the easiest possible way to enter accurate location data without learning technical formats.
Curators (Reviewers): Need tools to efficiently validate and standardize location data, catch errors, and ensure consistency.
Readers (Data discoverers): Need clear visual representations of where research took place and the ability to search by location.
What do they all have in common? These groups actually need many of the same features. Visual map interfaces: they let researchers verify their entries, curators spot errors, and readers understand geographic context.
Finding 7: Metadata vs. detailed data
An important distinction surfaced from the GIS specialist's perspective: we're building metadata capture, not a comprehensive GIS system.
We must stay in scope. We're not trying to replicate specialized geospatial tools. We're creating an intuitive way to capture and display location metadata that helps people understand and discover research.
Design solutions
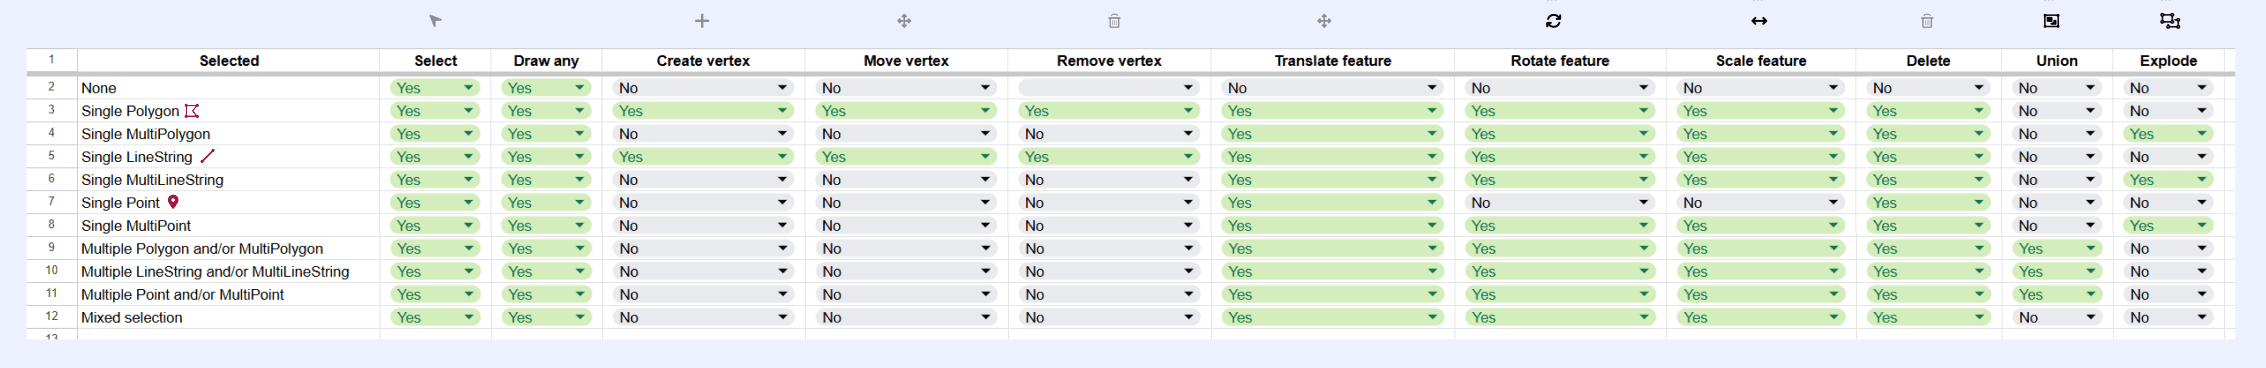
I started by organizing all potential features in a spreadsheet. This helped me define clear naming conventions, user actions, and appropriate iconography for each feature.
After that, I explored different approaches to displaying map features, drawing inspiration from existing tools. Since users frequently mentioned GeoJSON.io, I analyzed their interface to identify patterns that resonated with our users. I also reviewed mainstream mapping applications like Google Maps to understand best practices for search functionality, map styles, and mobile layouts.
The biggest challenge was making sense of all this complex information since we're not GIS experts, after all. I had to work closely with the technical team to understand what was actually happening, especially since we were using open source maps.
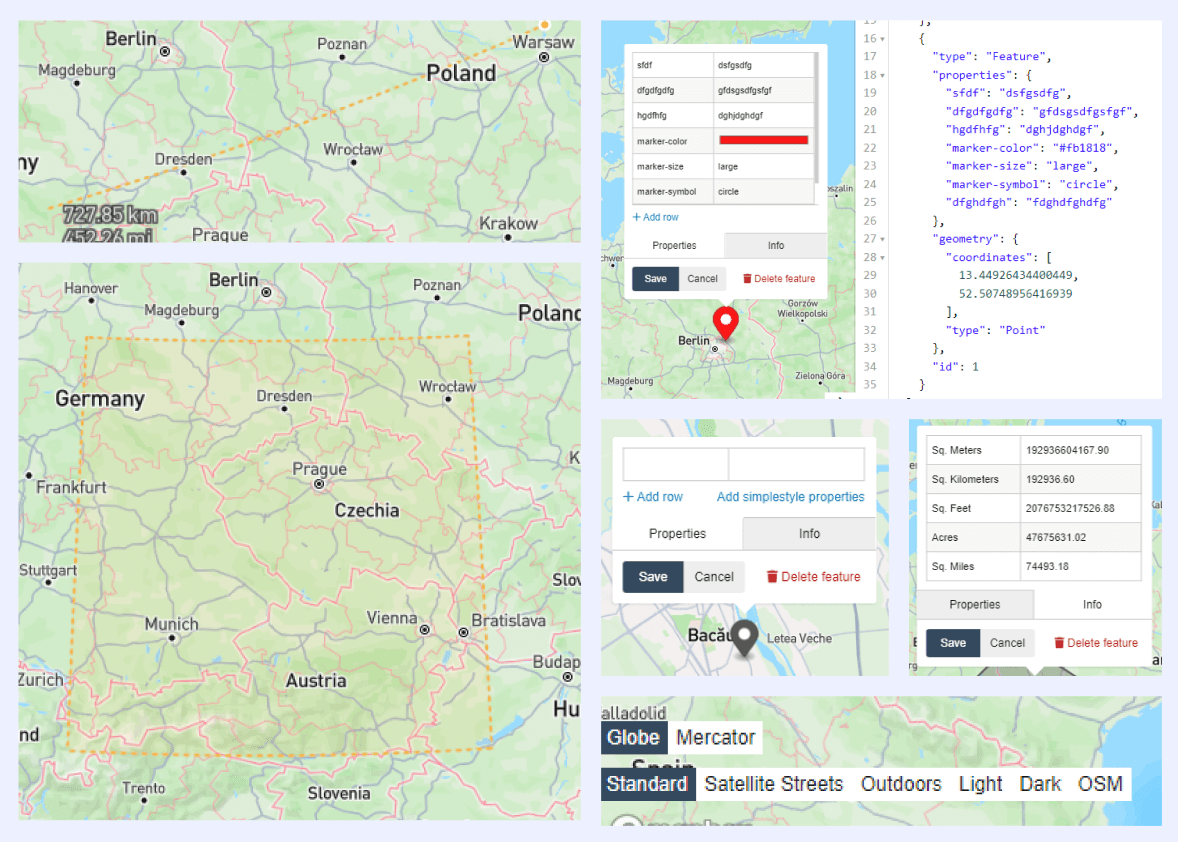
To address Finding 1 (users don't know GeoJSON), I designed three different ways for users to input their data: draw shapes directly on the map, type in latitude and longitude coordinates in a table, paste and edit JSON code or import a JSON file. No matter which method they use, the map will automatically update to reflect their changes. If anything conflicts or doesn't match up, it flags the error.


Users can also select which exact file related to their research (and down the line, we'll let them attach multiple files). Plus, they can add a description of the region where their research took place.


Since the UI had a lot going on, I wanted to make sure mobile users could still access as much functionality as possible. I turned the toolbar into a scrollable menu and changed the tabs into dropdown options.


Validation & results
The most valuable outcome of this research wasn't a specific feature request or design requirement, it was understanding the fundamental disconnect between our technical system and how researchers actually work.
Most importantly, we heard genuine enthusiasm for making this task easier. Despite the current system's limitations, researchers like Brian were already positive about Ag Data Commons.
Paul, the GIS Research Specialist, found the experience of inputting metadata fields and uploading datasets to be "a pretty good experience," though he noted that some fields requesting information from the user might be similar and it's not clear exactly what belongs in which one, suggesting that more description of exactly what's wanted for the fields could make it easier.
"I thought it was overall very easy to use and I really like it, it's better than pretty much any repository I've used. I'm used to it taking far longer to upload data actually. I just wanna say thanks. It's really nice."
Brian - Computational Biologist
Key learnings
Break it down, then build it up. This project taught me the value of stripping apart complexity until you get bite-size pieces you can actually work with. Geospatial metadata sounds intimidating, but once I broke it down into individual features, actions, and use cases, it became manageable. Starting with that Google Sheet to map everything out gave me a foundation to build on without getting overwhelmed by the big picture.
Validate early and often. With a project this complex, I learned that fact-checking early saves you from going down the wrong path. Regular check-ins with users and the dev team helped me catch assumptions before they became costly design decisions.
Collaboration is everything. Not being GIS experts meant we had to lean heavily on our users and dev team. That collaboration turned out to be one of the strongest parts of the process as it kept the design grounded in real needs and technical reality.